Basin modelling - calibration
Introduction
1D, 2D and 3D petroleum systems models all require calibration to ensure consistency with observations of the real petroleum system. Temperature and maturation level are fundamental to hydrocarbon generation and migration and consequently calibration data usually include borehole temperatures and vitrinite reflectance from wells within or close to the study area.
Other calibration data include lithology properties (porosity and permeability) and information on known hydrocarbon accumulations (such as the APvT database) and/or shows and well tests (oil and gas occurrence, properties, gas:oil ratio etc.).
The most commonly used calibration data are borehole temperature and vitrinite reflectance although others are possible including pressure, porosity, permeability and capillary pressure. Apatite fission track thermochronology and fluid inclusion microthermometry may provide valuable calibration of the thermal history but are not directly integrated into basin models.
APT routinely provide expert basin modelling with carefully QC'd calibration data to a variety of clients.
Borehole temperature
Measured temperatures from drill stem tests (DST) are regarded as the most reliable temperature dataset as they reflect true formation temperatures. However, temperatures measured during logging operations are lower than undisturbed, true formation temperatures, mainly because of the cooling effect of mud circulation.
Many methods that have been proposed to correct measured log-derived temperatures for the cooling effects of mud circulation.
The most widely used methods in the petroleum industry are methods that try to extrapolate the undisturbed temperature from a time-series of logging temperatures (i.e. Horner-type corrections). However, time-series of logging temperatures are often not available, and attempts have been made to develop methods to correct single bottom hole temperatures (i.e. single-point corrections). For a review of published temperature correction methods see e.g. Goutorbe et al., 2007, Hermanrud et al., 1990 and Peters and Nelson, 2012.
Horner-type corrections
Horner-type corrections utilise a time-series of at least three down-hole temperatures from a single depth. The technique was originally developed by Horner, 1951 to predict pressure build-up in a closed-in well, using an equation that extrapolates to infinite time. Dowdle and Cobb, 1975 presented an empirical method (1) utilising a modified Horner-plot to calculate true formation temperatures from logging temperatures.
\text{(1) } T=T_i-C \cdot log \frac{(t+\Delta t)}{\Delta t}
Where:
T=\text{true formation temperature}
T_i=\text{measured logging temperature at time } t+\Delta t
C=\text{Horner plot slope}
t=\text{circulation time}
∆t=\text{time since circulation}
However, various studies showed that Horner-plots systematically underestimate true formation temperatures (e.g. Goutorbe et al., 2007; Hermanrud et al., 1990) and methods have been developed to account for that issue. Hermanrud et al., 1990 showed that Horner-corrected temperatures in the Norwegian North Sea are on average 8°C to low compared to DST temperatures and based on that he proposed a simple correction of Horner-corrected temperatures (2).
\text{(2) } T=(T_i-C \cdot log \frac{(t+\Delta t)}{\Delta t})+8
Correction method (3) from Waples and Pedersen, 2004 is based on a data set from the Danish Central Graben.
\text{(3) } T=(T_i-C \cdot log \frac{(t+\Delta t)}{\Delta t})+26^{-0.0052 \cdot C}
Single-point corrections
In cases where a time-series of down-hole temperatures from a single depth do not exist, single-point corrections can be applied.
In general, single-point corrections apply a correction factor to the measured down-hole temperature to come up with an estimate of the true formation temperature. The applied correction factors are often depended on the time since circulation and the depth of the temperature measurement. Method (4) proposed by Waples and Ramly, 2001 was developed and calibrated using a data set from the Malay Basin.
\text{(4) } T=T_S+f \cdot (T_m-T_S)
Where:
T=\text{true formation temperature}
T_S=\text{surface temperature}
f=\text{correction factor}
T_m=\text{measured logging temperature}
∆t=\text{time since circulation}
Z=\text{measurement depth}
and
f=\frac{(-0.1462 \cdot ln \Delta t+1.699)}{0.572 \cdot Z^{0.075}}
Waples and co-authors tested the workflow for single-point temperature corrections on further data sets from different geological basins worldwide. The work resulted in the publication of a new formula and correction factor (5) based on a temperature data set from the Mexican Gulf of Mexico (Waples et al., 2004a).
\text{(5) } T=T_S+f \cdot (T_m-T_S)-0.001391 \cdot (Z-4498)
With:
f=1.32866^{-0.005289 \cdot \Delta t}
Another proposed temperature correction (6) by Waples et al., 2004b is based on a dataset from the Danish Central Graben
\text{(6) } T=T_S+f \cdot (T_m-T_S)
With:
f=\frac {3.07 \cdot \Delta t^{-0.09}}{0.47 \cdot Z^{0.175}}
The last presented single-point correction method (7) was proposed by Zare-Reisabadi et al., 2015 for wells from the Persian Gulf.
\text{(7) } T=T_S+f \cdot (T_m-T_S)
With:
f=1.012-0.0057 \cdot ln \Delta t + \frac{375.42}{Z}Vitrinite reflectance
Vitrinite reflectance is a commonly used thermal maturity indicator to calibrate a basin model to past thermal conditions. However, there are clear discrepancies in the quality of vitrinite reflectance measurements and in the quality of the model for the calculation of vitrinite reflectance. Factors like sample type, lithology, sample handling, and organic matter composition affect the quality of vitrinite reflectance measurements (Cardott, 2012).
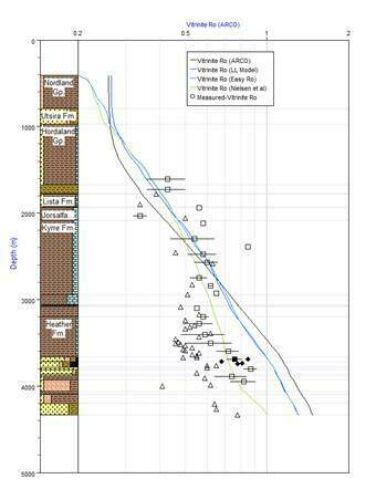
Vitrinite reflectance measurements are commonly plotted versus depth. Profiles showing a sublinear relationship between log %Ro and depth, indicate a continuous, time-invariant geothermal gradient. Profiles with distinct kinks between two linear segments (doglegs) indicate two periods of different geothermal gradient separated by a thermal event. Profiles with a sharp break or jump (offsets) indicate the existence of an unconformity with a large stratigraphic gap. Profiles in basins that have undergone continuous subsidence intersect the surface at values of 0.20 to 0.23% Ro. Inverted basins that have lost the upper part of the basin-fill by crustal uplift and erosion have profiles intersecting the surface at higher values of Ro (Allen and Allen, 2005).
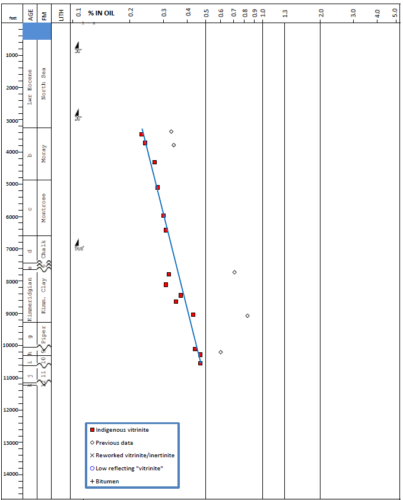
During the drilling of a well, up-hole sections may become progressively unstable due to physical and mineralogical characteristics of the rock and the rock’s interaction with the drilling fluid. This can result in up-hole intervals caving into the borehole, contributing lower maturity vitrinite particles to a cutting sample. In case of reworked vitrinite, pre-existing rocks containing vitrinite can be eroded and redeposited, thereby contributing potentially higher vitrinite particles to a sediment (Dembicki Jr., 2017).
Numerous attempts have been made to develop a chemical reaction model of coal maturation and vitrinite reflectance. However, the optimal vitrinite reflectance model is still an open question (Burnham, 2017). Probably the most commonly used model for the numerical simulation of vitrinite reflectance is the VITRIMAT model by Burnham and Sweeney, 1989.
Alternative models include the ARCO model modified after Falvey and Middlelon, 1981, the EASY %Ro model by Sweeney and Burnham, 1990, and the BASIN %Ro model by Nielsen et al., 2017. Keeping the inherent pitfalls in mind, the general vitrinite trends may be applied for thermal calibration purposes.
For a detailed review of vitrinite models and their historical evolution see Burnham, 2017 and Burnham et al., 2016.
APT are proud to offer high quality vitrinite analysis and interpretation services.
References
Allen, P.A., Allen, J.R., 2005. Basin Analysis - Principles and Applications, 2nd ed. Blackwell Publishing.
Burnham, A.K., 2017. Global Chemical Kinetics of Fossil Fuels. Springer Nature.
Burnham, A.K., Peters, K.E., Schenk, O., 2016. Evolution of Vitrinite Reflectance Models, in: AAPG 2016 Annual Convention and Exhibition.
Burnham, A.K., Sweeney, J.J., 1989. A chemical kinetic model of vitrinite maturation and reflectance. Geochimica et Cosmochimica Acta 53, 2649–2657.
Cardott, B.J., 2012. Introduction to Vitrinite Reflectance as a Thermal Maturity Indicator. Tulsa Geological Society luncheon. doi:10.1520/D7708-11
Dembicki Jr., H., 2017. Practical Petroleum Geochemistry for Exploration and Production. Elsevier, p. 342.
Dowdle, W.L., Cobb, W.M., 1975. Static Formation Temperature from Well Logs - An Empirical Method. Journal of Petroleum Technology 27, 1326–1330.
Falvey, D.A., Middlelon, M.F., 1981. Passive continental margins: evidence for a prebreakup deep crustal metamorphic subsidence mechanism. Oceanologica Acta 103–114.
Goutorbe, B., Drab, L., Loubet, N., Lucazeau, F., 2007. Heat flow of the eastern Canadian rifted continental margin revisited. Terra Nova 19, 381–386.
Hermanrud, C., Cao, S., Lerche, I., 1990. Estimates of virgin rock temperature derived from BHT measurements: Bias and error. Geophysics 55, 924–931.
Horner, D.R., 1951. Pressure Build-Up in Wells, in: Third World Petroleum Congress. The Hague, pp. 503–521.
Nielsen, S.B., Clausen, O.R., McGregor, E., 2017. basin%Ro: A vitrinite reflectance model derived from basin and laboratory data. Basin Research 29, 515–536.
Peters, K.E., Nelson, P.H., 2012. Criteria to determine borehole formation temperatures for calibration of basin models. SEPM Special Publication 5–15.
Sweeney, J.J., Burnham, A.K., 1990. Evaluation of a Simple Model of Vitrinite Reflectance Based on Chemical Kinetics. AAPG Bulletin 74, 1559–1570.
Waples, D.W., Pacheco, J., Vera, A., 2004a. A method for correcting log-derived temperatures in deep wells, calibrated in the Gulf of Mexico. Petroleum Geoscience 10, 239–245.
Waples, D.W., Pedersen, M.R., 2004. Evaluation of Horner plot-corrected log-derived temperatures in the Danish Central Graben, North Sea. Natural Resources Research 13, 223–227.
Waples, D.W., Pedersen, M.R., Kuijpers, P., 2004b. Correction of Single Log-Derived Temperatures in the Danish Central Graben, North Sea. Natural Resources Research 13, 229–239.
Waples, D.W., Ramly, M., 2001. A statistical method for correcting log-derived temperatures. Petroleum Geoscience 7, 231–240.
Zare-Reisabadi, M.R., Kamali, M.R., Mohammadnia, M., Shabani, F., 2015. Estimation of True Formation Temperature from Well Logs for Basin Modeling in Persian Gulf. Journal of Petroleum Science and Engineering 125, 13–22.