Production Allocation Using Geochemistry

Development of Fingerprinting & Production Allocation
Production allocation workflows have been around for decades, initially stemming from the development in the 1950’s and 60’s, of GC-based ‘oil fingerprinting’. Initial focus of these methods was around utility for reservoir continuity before developing into 2 zone (80’s) and then 2-7 zone (90’s) allocation solutions.
Although originally developed for conventional reservoirs, the expansion of unconventional resource plays has seen this workflow widely deployed in these plays during the past 10-15 years.
Conventional Vs. Unconventional Production Allocation
While the underlying approach for the two reservoir types (conventional and unconventional) remains the same, there are significant differences:
Production Allocation in Conventional reservoirs:
- Generates unique solutions
- Number of end members is known.
- End members and mixtures are the same sample type (e.g. oils, gases, etc)
- Laboratory confirmation of method is possible using mixtures, tested against mechanical meters.
- The mixing mathematics is known; equations weighted by peak concentration/mass.
Production Allocation in Unconventional reservoirs:
- Generates non unique solutions.
- Number of end members is not known.
- End members and mixtures are different sample types (e.g. cuttings/core for end members, oils for mixed samples).
- Solution is based on a model, method tested using synthetic models.
- Different mathematical solutions implemented.
Discrete Vs. Gradient Fingerprints
All of the above discussed differences mean that the error on allocation results differ between conventional and unconventional reservoirs.
In conventional reservoirs you are generally dealing with discrete, binary chemical fingerprints from high porosity/permeability flow units. This means – assuming fluids are sufficiently distinct from one another – that the error on allocation results is primarily tied to analytical method and is low, <5%.
This is not the scenario in unconventional reservoirs. These reservoirs contain chemical signatures which are generally gradients but – as is often the case with interbedded shales, silts and sands where porosity/permeability can vary by orders of magnitude - complex in how they vary stratigraphically. Discrete end members are therefore not always possible and grouping/binning to form 'end member' units is essential. This means that the error on allocation results is primarily tied to end member selection, grouping/binning choices and the gradients associated with end member selections. Therefore, the error for production allocation in unconventional reservoirs is higher than that for conventional reservoirs, at 5-10%, and depending upon data coverage and gaps, potentially larger.

End Member Resolution
When it comes to production allocation, one of the first questions often asked is ‘How many end members are possible?’ This can be quite tricky to answer because every single project is unique. But, it is possible to understand the range at which end member limitations arise.
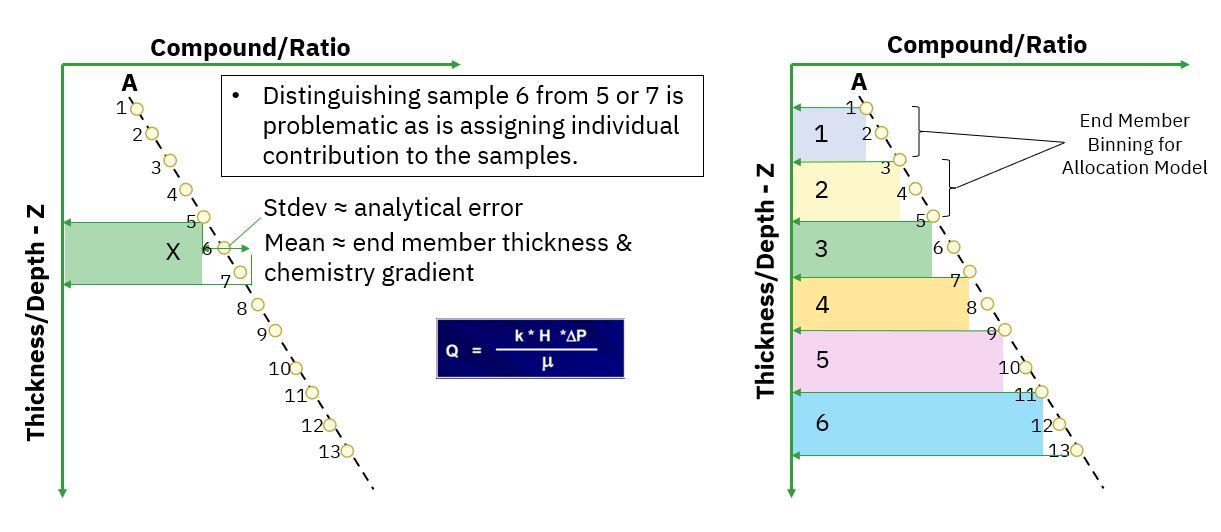
In unconventional reservoirs, where the goal is to build a stratigraphic/depth profile of geochemical changes, then the end member resolution can be seen as a function of the rate of:
- Change in the chemistry
- Analytical error of the measurement
- End member thickness selection
Ultimately, this means that higher resolution and greater stratigraphic definition is possible where change in chemistry is larger and/or analytical error is lower. Coefficient of variance (CV) is the ratio of the standard deviation to the mean and for most analytical methods, utilized for production allocation, the average CV is around 5%. The larger the CV the greater the potential for signature overlap between individual samples and the more restricted you become in end member definition. There are a number of mathematical algorithms for evaluating end member validity, the one which APT utilizes is co-correlation assessment via Rejection Sampling modelling.
Ultimately, what this means is that there is a limit in terms of the number of end members which can be defined within a baseline. Individual 10 or 20ft cuttings are generally geochemically too similar to be pulled apart individually and therefore grouping/binning samples, often between 30-60ft, is a necessity to define, viable end members from which to allocate against. A good rule of thumb, to ensure quantitative production allocation is meaningful in resource plays, is that end members are not truly feasible above single digits (<10). Once you get into double digits, co-correlation due to chemical overlap is such that the mathematical approaches, essential to generate allocation results, are no longer meaningful.
There is a whole array of statistical, correlative Machine Learning (ML) approaches which can be adopted to understand oil to baseline similarities across 10’s to 100’s of individual samples but, these are not allocation solutions. They offer valuable insight into the association between landing zones and baselines but, they are not representative of drainage behavior across these landing zones. Ideally, a robust and comprehensive workflow will utilize an array of these approaches to get a well rounded understanding of the wells being evaluated.
Concentrations & Ratios
Ratios of compounds are utilized as standard across the industry for production allocation projects. However, ratios should never be utilized on their own because ratios do not mix in a linear manner but generate mixing curves and not all by the same magnitude or direction. This means that any allocation approach, purely using ratios for the mixing equations, have the potential to add in additional – significant – error into the results. This has been well published on by numerous authors, in numerous disciplines over several decades, but still misunderstanding surprisingly crops up regularly.
In conventional reservoirs you can account for this challenge by creating in-house mixtures and building mixing curves from which to calibrate against. In unconventional reservoirs, due to the nature of the end member samples, this is not feasible. Therefore, in order to generate valid allocation results in unconventional reservoirs you also need to also ensure you utilize concentration data in order to appropriately weight the ratios and end members in any solutions.


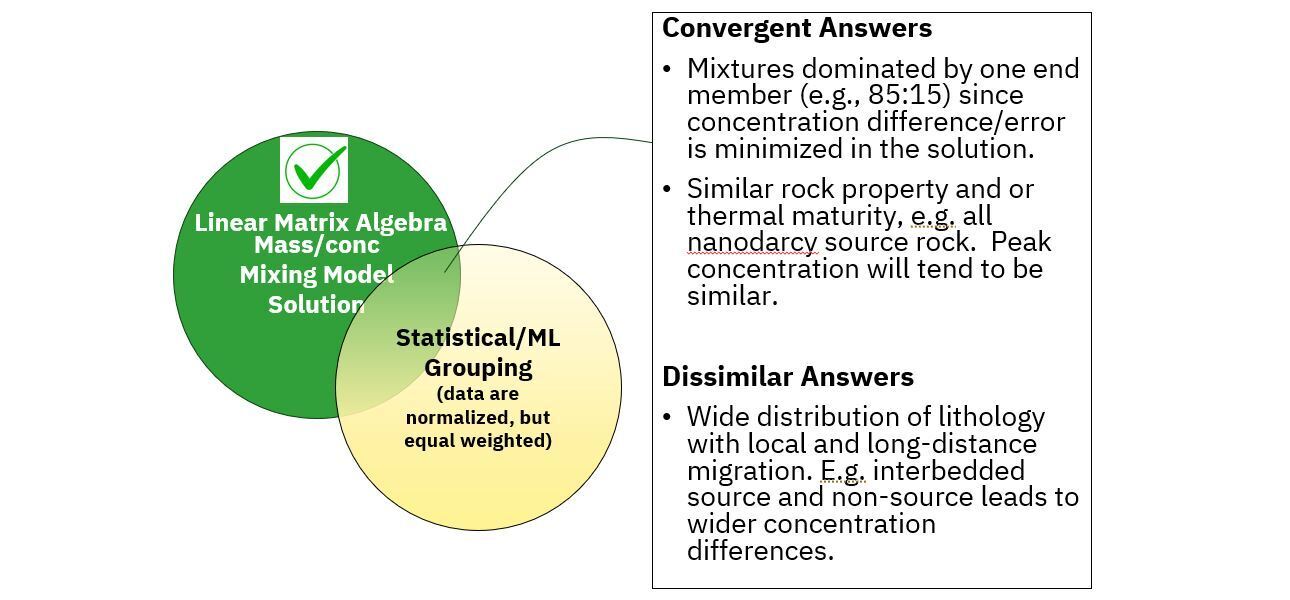
It is possible to get convergent answers between concentration weighted and equally weighted (ratio only) approaches. But, this convergence occurs where mixtures are dominated by only a single end member (e.g. 85:15) and therefore linearity is not so much of an issue or where rock properties/thermal maturity of fluids is similar and therefore concentrations tend to be similar. Non convergence of solutions will be exacerbated where there is a mixture of lithologies (e.g. shales, silts, sands, etc) and interbedded source and non-source horizons such that wide concentrations differences exist.
Given, the challenges and considerations just around end member selection – as discussed above - ratio only solutions are likely to result in even larger errors in allocation projects. Ratio only approaches are appropriate for statistical and machine learning data correlations, which are well published on, but, are not a viable quantitative allocation approach.